How Much Retirement Corpus Do You Need in India?

By Tapabrata Biswas · Published August 27, 2026 · 21 min read
Written and fact-checked by Tapabrata Biswas. How I write
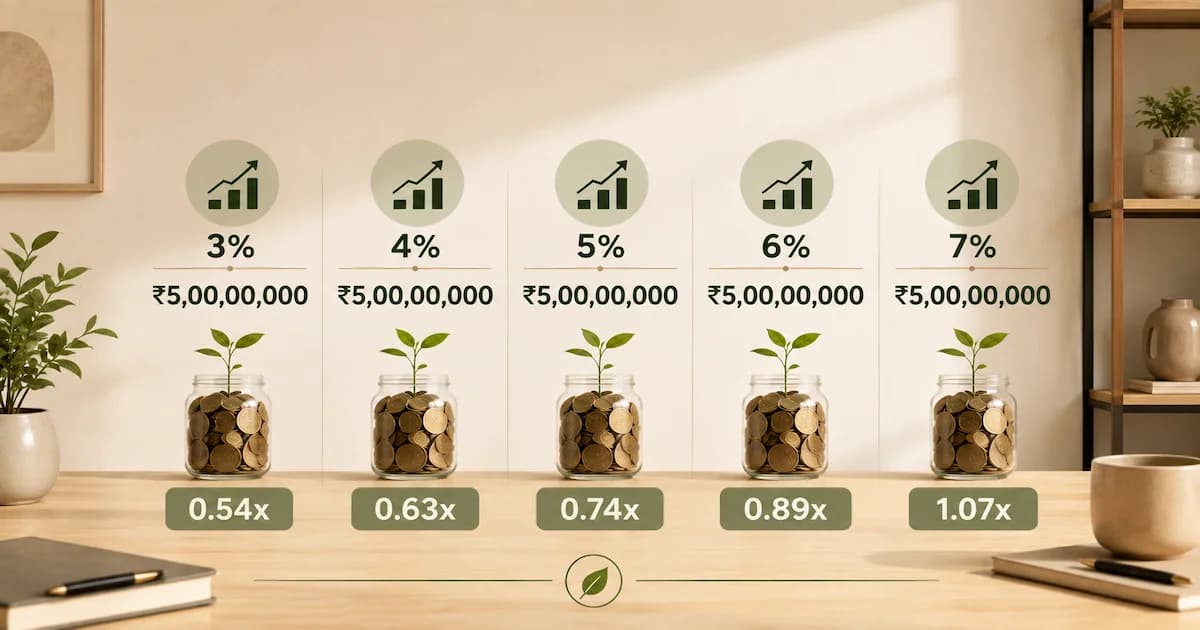
On 27 August 2026 we read more than thirty Indian pages that answer this question. The lowest said 58.18 lakh rupees. The highest said 21.80 crore.
That is a spread of nearly forty times, on a question with real arithmetic behind it. It is tempting to read it as disagreement about India, or about lifestyle, or about how frightened you should be. It isn't. Almost all of it comes from a single number that most of those pages never show you.
What is a retirement corpus?
A retirement corpus is the amount of money that has to be in place on the day your salary stops, sized so it can pay for rising expenses for as long as you need it to. That is the whole definition.
Three things sit inside it. What you spend, grown forward to the year you retire. How long the money has to last. And what the money earns while you are spending it.
The third one is where the answers come apart.
How much retirement corpus do you need?
There is no single figure, and any page that gives you one without naming its assumptions has hidden the interesting part. A worked case, with everything stated.
Someone aged 35, spending 50,000 rupees a month today, planning to stop working at 60 and to have money until 90. Inflation at the Reserve Bank of India's statutory 4% target. The corpus earns 6% a year through retirement.
By 60, that 50,000 a month has become 15,99,502 rupees a year. The corpus needed to fund that stream, rising with inflation, until 90, is 3.69 crore rupees.
Which is 23.1 times the first year of retirement spending.
Not 25x. Not 30x. Not 33x. Those numbers get quoted as though they were properties of the country, like the monsoon. They are outputs.
Why does the same plan need 16.5x and 34.6x?
Because the multiple falls out of one assumption, and it is the assumption nobody can actually know. What does your corpus earn after you stop working?
Hold every single other input fixed. Same age, same spending, same retirement date, same terminal age, same 4% inflation. Move only the post-retirement return.
| If the corpus earns | Real return | Corpus needed | Multiple |
|---|---|---|---|
| 3% | -0.96% | 5.54 crore | 34.6x |
| 4.5% | +0.48% | 4.48 crore | 28.0x |
| 6% | +1.92% | 3.69 crore | 23.1x |
| 7.5% | +3.37% | 3.09 crore | 19.3x |
| 9% | +4.81% | 2.63 crore | 16.5x |
One input. The answer more than doubles.
The middle column is what actually matters. Your corpus does not care about the nominal return, it cares about the gap between that return and inflation. At 6% against 4% inflation the real return is 1.92%, and that single number is doing nearly all the work in the table.
This is why the field's numbers scatter so badly. A distributor assuming 12% both before and after retirement lands at 12.5x, which makes the required monthly saving look small. An analysis assuming 5% against 6% inflation, so a negative real return, lands at 34.5x. Both are internally consistent. Neither is wrong arithmetic. They are answering different questions and presenting the answers identically.
Our retirement corpus calculator reports the multiple as an output for exactly this reason, and shows the whole band.
If you would rather run it on your own machine, the same model is a free Excel workbook. The formulas in it are live, so changing an assumption moves every number on every sheet. That seemed like the only honest way to publish a calculation whose answer depends this heavily on one input you cannot know.
How long should the money last?
Life expectancy at age 60 in India is 18.6 years, to roughly age 79, per the Registrar General's SRS Abridged Life Tables 2020-24. For men it is 17.5 years and for women 19.8.
Now watch what the terminal age alone does, with every other input held at the same worked case above.
| Plan runs to age | Corpus needed | Multiple |
|---|---|---|
| 79 | 2.57 crore | 16.1x |
| 85 | 3.21 crore | 20.1x |
| 90 | 3.69 crore | 23.1x |
| 95 | 4.13 crore | 25.8x |
| 100 | 4.52 crore | 28.3x |
The target nearly doubles across that range, and the reader never touched a rate.
Three things make the raw life-table number the wrong one to plan to, and all three point the same way. Half of people outlive their own life expectancy, which is arithmetic rather than pessimism, and it is the point Bengen makes himself, that by definition you have a 50% chance of living beyond your actuarially determined life expectancy. These are also period tables, which do not project future improvements in mortality, so they understate the horizon for someone retiring twenty years from now. And state variation is wide, running from 20.5 years at 60 in Himachal Pradesh to 15.0 in Chhattisgarh.
Across the pages we read, terminal ages ran from 70 to 100, several never stated one, and not one benchmarked its figure against a published mortality table. Two pages do quote a life-expectancy number. One says 72, the other 73, and both are quoting expectancy at birth. That is the wrong statistic for this job, and it is wrong in a specific direction. Expectancy at birth is an average across everyone, including those who die at 5 and at 40. A person who has actually reached 60 has already outlived every one of those deaths, so their remaining expectancy is measured from 60 and lands them near 79. Planning off the at-birth figure quietly removes about six years from the plan.
One of India's largest retail brokers hard-codes a life expectancy of 70 into its widget, giving a ten-year retirement, and that single choice is most of why its answer comes out at 58.18 lakh while a comparable case elsewhere gives 5.7 crore.
What do the published multiples actually deliver?
On several of the largest Indian pages, the multiple recommended in the prose and the multiple delivered by the page's own worked example are different numbers.
We checked each page's arithmetic against its own published figures. One insurer recommends "a lower 30-33x" and its worked example delivers 16.7x. A tax-filing company quotes a 3.5% to 4.5% withdrawal rate, implying 22x to 29x, above a table implying 35x to 47x. A life insurer applies the multiple to today's expenses with no inflation adjustment, immediately after a section explaining that you must not do that.
Checking every page's own arithmetic this way produces a number worth stating on its own. The multiple these pages actually deliver, as opposed to the one they recommend, runs from about 5x to 40x. Pages competing for the same reader, on the same day, eight times apart.
And underneath that sits something the field almost never flags, which two separate passes over the ranking set reached independently. Where the multiple gets applied moves the answer more than which multiple you pick. Some pages multiply today's annual expenses by 25. Others inflate the expense forward to the retirement year first, then multiply. At 6% over 25 years that difference is about 4.3 times, which dwarfs the gap between 25x and 33x. Two pages can both say 25x, both do their arithmetic correctly, and be four times apart in the answer.
The explanation for most of the rest is mundane. The prose is written by a content team, the widget is built by an engineer, and nobody reconciles them. Some of what we found is simply broken:
- One calculator returns 7.64 crore as its default and 2.97 crore in its own scenario one, on identical inputs. Same age, same expense, same three rates, one page.
- Another publishes a table it labels a drawdown schedule in which the corpus grows from 9.94 crore at 60 to 87.41 crore at 83, because it applies the pre-retirement return of 12% straight through retirement. The line above the table promises to show how the money depletes.
- A broker's FAQ states that most financial experts agree a corpus of 1 crore is enough, on the same page as its own calculator output of 58.18 lakh.
- One structured FAQ answer, the kind search engines lift directly, publishes a formula that divides by inflation instead of multiplying, so it shrinks the corpus the further away retirement is. The same page's worked example does it correctly. The wrong one is the one in the schema.
- One page carries a lakh figure into a crore slot and reports a post-tax corpus requirement of 25.7 crore where its own inputs give about 7.3 crore. The heading above it promises to reveal the gap nobody shows you.
- A lending platform's worked example builds a corpus at 30x and then withdraws 4% of it, which spends the entire safety margin the article spent a thousand words arguing for. Its persona also changes name halfway through the paragraph.
There is a broader finding underneath all of this, and it took the wider sample to see it properly. Almost nothing on these pages is sourced, and the exceptions line up with who has nothing to sell.
On most of the thirty-odd pages, the inflation rate, the return and the terminal age are simply asserted. A handful do better. One cites the 4% rule to Bengen's 1994 paper and another to the Trinity study. One independent site runs its own Monte Carlo, ten thousand paths, and publishes every assumption behind it. Another cites named peer-reviewed Indian research on withdrawal rates.
The page that anchors its assumptions hardest is the one with no product at all. The National Institute of Securities Markets, a public trust established by SEBI, tells the reader to use an inflation assumption between 4% and 7% because the Reserve Bank's Monetary Policy Committee has a target of 4% to 6%. That is the only page we found reasoning from the actual statutory target. It is also the only page in the set with nothing to sell, no lead form and no email gate.
Meanwhile the one mainstream news page that names a source for its headline number sourced it from the insurer that commissioned the survey.
What do Indian retirement calculators leave out?
Four things, and they are the same four almost everywhere.
The NPS annuity requirement. For a non-government subscriber the gazetted floor is that at least twenty percent of accumulated pension wealth must be used to buy an annuity. That was cut from 40% by the December 2025 amendment to the PFRDA exit regulations. A corpus of 8 lakh or less can be taken entirely as a lump sum, and between 8 and 12 lakh the lump sum is capped at 6 lakh. Government sector subscribers stay at 40%. Much of the Indian personal finance web still publishes 40% for everyone. PFRDA's own FAQ page does, and so do at least five of the pages we read, several of which recommend NPS as a retirement instrument in the same breath.
The lock matters more than its size suggests, because Indian annuities are almost entirely non-increasing. One unit of non-increasing pension costs roughly 12 times the annual payment, against a typical actuarial estimate of 22 times for an increasing one, which is not really available here. On the 3.69 crore corpus above with 40% of it in NPS, the 20% floor locks about 29,52,099 rupees into an annuity paying roughly 2,46,008 rupees a year, flat, for life. At 4% inflation that payment is worth 1,12,275 in today's money after twenty years. Less than half. Nothing in the field models this. More on how the scheme works in our guide to the National Pension System.
Tax. Several pages discuss tax well, comparing the slab rate on fixed-deposit interest against capital gains on a withdrawal plan. What none of them does is apply it inside the calculation. The corpus a reader is shown is a pre-tax number on every calculator we could run. The sharpest instance is a tax-filing company whose retirement calculator applies zero tax on a page carrying a prompt to file your return and save more taxes.
Continuing contributions. Existing savings are treated as a static lump sum everywhere. In reality an employee's EPF keeps receiving a monthly contribution with an employer match right up to retirement, which makes it a stream.
Gratuity. Named on two pages out of more than thirty, and quantified on neither. One is an advisory firm listing it among assets to inventory. The other is the SEBI-established institute, whose calculator has a field for money received from an employer at retirement and names EPF and gratuity in the instruction. Everywhere else it is missing, including on sites that run a standalone gratuity calculator on the same domain.
How does this compare with the American 4% rule?
The 4% rule says you can withdraw 4% of your starting portfolio in the first year and raise that amount with inflation thereafter, and 25x is simply its inverse. It is the same arithmetic that sits under the FIRE movement's savings targets. It comes from William Bengen's paper in the Journal of Financial Planning in October 1994, and from the 1998 Trinity study that popularised it.
Two things in the original papers travel badly to India, and both authors said so at the time. Bengen wrote that he was assuming all retirement assets sat in tax-deferred accounts, so capital gains tax was not a concern, and that the conclusion might have been different otherwise. The Trinity paper states that it did not adjust for taxes or transaction costs.
The Indian work that does model tax reaches a different number. Raju and Saraogi, presenting to the Institute of Actuaries of India in November 2024, found the 4% rule is not suitable for the Indian market and put the appropriate range at 3.0% to 3.5%. Their method ran Monte Carlo and circular bootstrap simulations, 50,000 iterations each, with equity at 40% to 50%, horizons of 25, 30 and 35 years, and tax at 30% on fixed deposits and 10% on equity. Their arithmetic of the drag is worth repeating: at a nominal 5% return against 7% inflation, an investor in the 30% bracket loses the 2% gap plus 1.5% to tax, so 3.5% a year.
The 4% rule has no settled current value even in the country it came from.
| Source | Current number | Implied multiple |
|---|---|---|
| Morningstar, December 2025, for 2026 | 3.9% | 25.6x |
| Bengen's own recommendation, August 2026 | around 5.5% | 18.2x |
| Bengen's historical worst case | 4.7% | 21.3x |
| Raju and Saraogi, India, November 2024 | 3.0% to 3.5% | 33.3x to 28.6x |
Morningstar's 3.9% assumes a 90% probability of money remaining after 30 years, at an equity weighting between 30% and 50%, and it excludes state pension income. It has moved every year: 3.3% in 2021, 3.8% in 2022, 4.0% in 2023, 3.7% for 2025, now 3.9%.
Bengen's own figures come from the same body of work read differently. His safe maximum withdrawal rate has ranged historically from 4.7% for someone retiring in October 1968 to 16.2% for someone retiring in July 1932, averaging 7.1%. The 4.7% is the worst case in a century of American data, not a recommendation, and in August 2026 he told an interviewer he would now suggest something around 5.5%.
So the two live authorities on the American rule sit more than a third apart, and neither number is 4%.
One more comparison worth having in one place, because we could not find it anywhere else. Life expectancy at 60 in India is 18.6 years. Life expectancy at 65 in the United States is 19.7 years, from the National Center for Health Statistics tables published on 25 August 2026, covering 2024 data. An Indian at 60 and an American five years older have almost exactly the same number of years ahead. The Indian retiree has to fund a longer stretch of them, and has no equivalent of Social Security or Medicare doing part of the work.
The other half of the American picture is what people have actually saved, and it is thinner than the rules of thumb imply. Vanguard's How America Saves 2026, covering nearly five million participants as at 31 December 2025, puts the median balance for ages 55 to 64 at 107,269 dollars against an average of 305,006. The Congressional Research Service, working from the Federal Reserve's 2022 survey, found only 54.3% of American households held any retirement account at all.
The by-age benchmarks built on top of those balances are a separate argument, and they disagree more than they look. Fidelity publishes 3x salary by 40 where T. Rowe Price publishes 1.5x to 2.5x, and the Indian pages quoting either figure usually quote neither firm's assumptions. We take that apart in retirement savings by age.
What this post deliberately does not cover
Which instruments to hold, in what proportion, at any age. That is portfolio advice and it depends on your tax position, your other income, your dependants and your capacity to tolerate a fall. It needs a person who knows your situation.
Whether any specific number is enough for you. Every figure here is a worked illustration of a method, using stated inputs. Change the inputs and the answer changes, which is the entire argument of this post.
Tax treatment of NPS lump sums, NPS annuity income, or EPF withdrawals. The Income-tax Act 1961 was repealed on 1 April 2026 and replaced by the Income-tax Act 2025, which renumbered the sections most published guidance still cites. We are not going to restate rules we have not verified against the current Act.
Medical inflation. The widely repeated Indian figure of 14% to 15% has no primary source we could find. Official CPI Health inflation in July 2026 was 1.34%. Credible measured estimates range from about 7% on a price basket to about 13% on insured-population plan costs, and those measure different things on different populations. A number that spans that range is not a planning input, it is a placeholder.
Retirement planning is a YMYL subject where the details of your own situation change the answer. A SEBI-registered investment adviser or a certified financial planner can look at your actual position, and a chartered accountant can tell you how the current Act treats each of these withdrawals.
Frequently asked questions
How much retirement corpus do I need in India?
There is no single number, and the honest answer names the reason. For someone aged 35 spending 50,000 rupees a month today, retiring at 60 and planning to 90, at the Reserve Bank of India's 4% inflation target, the corpus works out at about 3.69 crore rupees. That is 23.1 times the first year of retirement spending. But change only what the corpus earns after retirement, from 6% to 3%, and the same plan needs 5.54 crore, or 34.6 times. Change it to 9% and it needs 2.63 crore, or 16.5 times. Nothing else moved. The multiple is an output of that one assumption, which is why published answers for the same question range from 58 lakh to more than 21 crore.
Is the 25x rule right for India?
The 25x figure is the inverse of a 4% withdrawal rate, and it was derived from United States market history. Two things break the transfer. Bengen's original 1994 paper states plainly that it assumed all retirement assets sat in tax-deferred accounts, so capital gains tax was not a concern, and that the conclusion might have been different otherwise. The Trinity study that popularised it also states it did not adjust for taxes or transaction costs. Indian research that models tax explicitly, by Raju and Saraogi, presented to the Institute of Actuaries of India in November 2024, puts the appropriate withdrawal rate at 3.0% to 3.5%, which implies 33.3x to 28.6x.
How long should a retirement plan cover?
The Registrar General of India's SRS Abridged Life Tables 2020-24 put life expectancy at age 60 at 18.6 years, so an average 60-year-old reaches about 79. The word average is doing the work. Roughly half of people outlive their own life expectancy, which is the point Bengen himself makes, and these are period tables that do not project future improvements in mortality, so they understate the horizon for someone retiring today. State variation is wide too, from 20.5 years at 60 in Himachal Pradesh to 15.0 in Chhattisgarh. In our own model the terminal age alone moves the answer from 16.1x if the plan runs to 79, to 28.3x if it runs to 100.
How much of an NPS corpus must go into an annuity?
For a non-government sector subscriber the floor is 20% of accumulated pension wealth, and the gazetted wording is that at least twenty percent shall be mandatorily utilised for purchase of annuity. That was cut from 40% by the December 2025 amendment to the PFRDA Exits and Withdrawals regulations. A corpus of 8 lakh rupees or less can be taken entirely as a lump sum. Between 8 and 12 lakh the lump sum is capped at 6 lakh. Government sector subscribers remain at a 40% floor, and a premature voluntary exit remains at 80%. A great deal of published Indian guidance, including PFRDA's own FAQ page, still shows the old 40%.
What is a safe withdrawal rate in India?
The most credible Indian estimate is 3.0% to 3.5%, from Raju and Saraogi's work presented to the Institute of Actuaries of India in November 2024. Their method used Monte Carlo and circular bootstrap simulation with 50,000 iterations, equity at 40% to 50%, horizons of 25, 30 and 35 years, and tax modelled explicitly at 30% on fixed deposits and 10% on equity. Their statement of the tax drag is the clearest anywhere: at a nominal return of 5% against inflation of 7%, an investor in the 30% bracket is losing the 2% gap plus 1.5% in tax, so 3.5% a year. The higher Indian multiple is real, and tax and volatility are what produce it.
Why do retirement calculators give such different answers?
Mostly because of two inputs that are rarely shown and almost never sourced. The first is what the corpus earns after retirement, which sets the real return and therefore the multiple. The second is the terminal age. Among more than thirty ranking Indian pages read on 27 August 2026, terminal ages ran from 70 to 100, several never stated one, and not one benchmarked the figure against a published mortality table. Sourcing is thin across the whole set. The page that anchors its assumptions most carefully is the one run by the National Institute of Securities Markets, a public trust established by SEBI, which points at the Reserve Bank's 4% to 6% target and is also the only page in the set with no product to sell.
Sources
- Reserve Bank of India, Monetary Policy Framework for the 4% inflation target with a 2% to 6% tolerance band, retained on 25 March 2026 for the period 1 April 2026 to 31 March 2031.
- Press Information Bureau, Consumer Price Index for July 2026 for all-India CPI inflation of 4.45% provisional, rural 4.84% and urban 3.96%, on base 2024=100.
- Registrar General of India, SRS Abridged Life Tables 2020-24 for life expectancy at age 60.
- PFRDA, Exits and Withdrawals under the National Pension System Regulations for the annuity floor and the lump sum thresholds.
- Bengen, Determining Withdrawal Rates Using Historical Data, Journal of Financial Planning, October 1994 for the origin of the 4% rule and its stated tax assumption. The link is the FPA's own PDF of the paper, reprinted in 2004 for the Journal's 25th anniversary.
- Morningstar, What's a Safe Retirement Withdrawal Rate for 2026 for the 3.9% figure and the year-by-year history.
- Morningstar, The Long View, Bill Bengen interview for the historical range of the safe maximum withdrawal rate and Bengen's own view on planning horizons.
- National Center for Health Statistics, Mortality in the United States, 2024 for United States life expectancy at 65 of 19.7 years.
- Vanguard, How America Saves 2026 for median and average balances by age as at 31 December 2025.
- Congressional Research Service, Distribution of Retirement Account Balances for the 54.3% household ownership figure from the 2022 Survey of Consumer Finances.




You might also like

What is the FIRE movement? A plain-English explanation of Financial Independence Retire Early, the math, the variants, and the trade-offs of the FIRE framework.
11 min read

NPS entry now runs to age 85, and non-government exits need only 20% annuity since December 2025. What the new tax regime allows, and what it takes away.
14 min read

What is inflation? A plain-English explanation of how prices rise, how it is measured, and what it actually means for everyday savings, wages, and debt.
11 min read