Loss Aversion: What It Is, Examples & Investing Impact

By Tapabrata Biswas · Updated July 4, 2026 · 14 min read
Written and fact-checked by Tapabrata Biswas. How I write
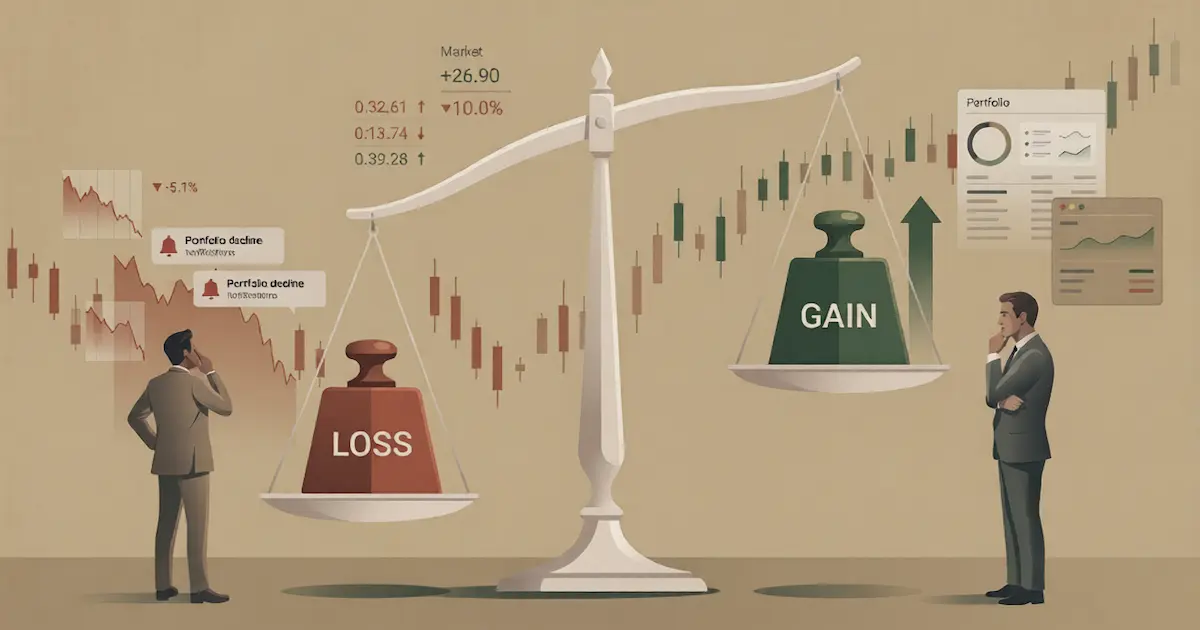
Loss aversion is the reason a ₹10,000 loss can ruin your week while a ₹10,000 windfall barely registers by the weekend. It is one of the most reliable findings in all of behavioural economics, and it quietly shapes how people invest, spend, and avoid risk in both India and the US. Losses simply hurt more than equal gains feel good, by a factor of about two, and that lopsided feeling drives a long list of money mistakes.
This guide gives you the clean definition first, then the exact number behind "about twice as painful," a list of real examples, the difference between loss aversion and risk aversion, and how the bias plays out in actual investing, with rupee and dollar cases and the India angle that most explainers skip.
What is loss aversion?
Loss aversion is the tendency to feel the pain of a loss about twice as intensely as the pleasure of an equivalent gain. It was formalised by psychologists Daniel Kahneman and Amos Tversky, whose 1979 research summed it up in four words that became famous in economics: "losses loom larger than gains."
The key idea is that people judge outcomes against a reference point, usually their current situation or what they paid, and not in absolute terms. A stock at ₹700 feels like a painful loss to someone who bought at ₹1,000 and like a pleasant gain to someone who bought at ₹500, even though it is the same ₹700 stock. Because the loss side of that reference point is felt roughly twice as steeply as the gain side, the same rupee swing carries very different emotional weight depending on which direction it moved.
Loss aversion is a cognitive bias, meaning it is an automatic quirk in how the brain values outcomes, not a reasoning error you can simply argue yourself out of. That distinction matters, and it is why the practical fixes later in this guide are about structure, not willpower.
How much more painful is a loss? The 2.25 ratio
Almost every article says a loss hurts "about twice as much" as a gain, but few give the actual number. The precise figure is a loss-aversion coefficient, written as lambda, of about 2.25. That estimate comes from Tversky and Kahneman's 1992 paper "Advances in Prospect Theory," the follow-up study that put a measured value on the 1979 idea. Across later studies the number ranges from roughly 1.8 to 2.5, with financial losses sitting toward the higher end, so 2.25 is a solid central estimate.
What does 2.25 mean in money terms? A ₹10,000 loss carries roughly the emotional weight of a ₹22,500 gain. Put the other way, most people will only accept a fair coin-flip bet when the possible win is about 2.25 times the possible loss. They will take "win ₹2,250 or lose ₹1,000" but refuse "win ₹1,000 or lose ₹1,000," even though the second bet is perfectly fair. That refusal, repeated across a lifetime of choices, is loss aversion doing its quiet work.
Loss aversion examples
The bias is easiest to spot in concrete cases. These are the ones that show up across the research and in everyday money life:
- The symmetric coin flip. People refuse a 50/50 chance to win or lose the same amount, because the possible loss looms larger than the equal possible gain.
- The endowment effect. In the classic Kahneman, Knetsch, and Thaler mug experiment, people who were given a mug demanded about twice as much to sell it as others were willing to pay to buy it. Owning something makes giving it up feel like a loss.
- The disposition effect. Investors sell winning stocks too early to "lock in the gain" and hold losing stocks too long to avoid "making the loss real." More on this below, because it is the costliest version.
- Insurance and extended warranties. Buying cover against a small-probability loss is partly rational and partly loss aversion, overweighting the pain of the unlikely bad outcome.
- Free trials and auto-renewals. Once you are using a service, cancelling feels like losing something you have, which is why "you will lose access to X, Y, and Z" keeps people subscribed.
- Discount versus surcharge framing. A "₹20 cash discount" feels better than avoiding a "₹20 card surcharge," even when the two prices are identical, because one is framed as a gain and the other as a loss.
That last pattern is why marketing leans so hard on loss language. "Protect your family from financial loss" reliably outperforms "secure your family's future," and trading apps put small daily losses in bright red to make normal volatility feel significant. Recognising the frame is the first step to deciding separately from it.
Loss aversion vs risk aversion
These two get used interchangeably, but they are not the same thing, and the difference is a common exam and interview question.
| Loss aversion | Risk aversion | |
|---|---|---|
| What it is | Losses weigh about twice as much as equal gains | Dislike of uncertainty itself |
| Measured from | A reference point (what you paid, what you had) | The spread of possible outcomes |
| Treats gains and losses | Asymmetrically (loss side is steeper) | Can treat them symmetrically |
| Typical effect | Can make you take more risk to avoid a loss | Makes you prefer a sure thing to a gamble |
| Example | Holding a losing stock so the loss is not "real" | Choosing a fixed deposit over a volatile fund |
The sharpest distinction: a risk-averse person prefers certainty even when a gamble has the same average value. A loss-averse person specifically dislikes the loss side more than the gain side, which can flip into extra risk-taking, such as doubling down on a losing position instead of accepting the loss. So loss aversion is not simply "being cautious." It is a lopsided reaction to losses in particular.
The 1979 research that changed economics
Before Kahneman and Tversky, mainstream economics assumed people were expected-utility maximisers who weigh probabilities and pick the highest average outcome. The model was tidy but kept failing against real behaviour. Their 1979 Prospect Theory paper, published in Econometrica, made three corrections that fixed the mismatch.
First, people judge outcomes relative to a reference point, not in absolute wealth. Second, the value function is steeper for losses than for gains, which is loss aversion itself, with a sharp kink at the reference point. Third, people overweight small probabilities and underweight large ones, which is why both lottery tickets and insurance sell so well. Together these produce a model that predicts actual financial behaviour where the older theory could not. The paper is now one of the most cited in all of economics, and Kahneman received the 2002 Nobel Prize in Economic Sciences for the work.
Worth an honest footnote: not everyone agrees on how much of the effect is "pure" loss aversion. Researchers such as David Gal have argued that part of what looks like loss aversion is really status-quo inertia, a general tendency to leave things as they are. The core finding still holds up broadly, but the size of the effect depends on how it is measured.
Loss aversion in investing
This is where loss aversion costs real money, and it does so mostly through one pattern.
The disposition effect is the tendency to sell winning investments too early and hold losing ones too long. Hersh Shefrin and Meir Statman named it in 1985, and Terrance Odean put hard numbers on it in a 1998 study of 10,000 brokerage accounts. Investors realised their gains at roughly a 50% higher rate than their losses, and, tellingly, the winning stocks they sold went on to outperform the losing stocks they kept by about 3.4 percentage points over the following year. They were systematically selling the wrong holdings, driven by the urge to book a gain and avoid making a loss feel real.
The second pattern is panic selling. When markets drop hard, in 2008, in March 2020, in 2022, investor flows show net selling near the bottom, because watching the number fall is more painful than the analysis is reassuring. Then they miss the recovery. Morningstar's annual Mind the Gap study measures the cost: over the decade to the end of 2023, fund investors earned about 6.3% a year while the funds themselves returned about 7.3%, a gap of roughly 1.1 percentage points a year that came purely from mistimed buying and selling. Across Mind the Gap editions the gap runs about 1 to 1.7 points, and the funds with the most volatile flows show the widest gaps.
A 1-to-2-point annual gap sounds small until it compounds. Take two Indian investors, both 30, both putting ₹3,00,000 a year into the same equity fund for 30 years:
| Investor | Behaviour | Annual return | Corpus after 30 years |
|---|---|---|---|
| A | Buys and holds, ignores the noise | 12.0% | about ₹7.2 crore |
| B | Sells low and re-enters late (loss-aversion gap) | 10.5% | about ₹5.4 crore |
The roughly ₹1.8 crore difference is not fees or fund selection. It is the compounded cost of letting loss aversion drive the timing.
Loss aversion in India
The Indian angle is the one most explainers miss, and it is striking, because loss aversion shows up in national saving habits.
For years, SEBI and RBI surveys have found that around 95% of Indian households prefer bank fixed deposits, with only a small share comfortable holding stocks or mutual funds. A lot of that is loss aversion in action: the fear of a possible loss keeps money parked in FDs and gold, treated as emotional anchors of safety, even when the long-run cost is much lower growth. Avoiding the market entirely is loss aversion's quietest and most expensive form.
The second Indian pattern is holding losers. A very common line among retail investors is "I will sell once it gets back to my buy price." A stock bought at ₹1,000 falls to ₹700, and instead of judging it on its future, the investor waits for the reference point, sometimes for years, while the same person books a small winner quickly to "be safe." That is the disposition effect in rupees.
The third is pausing SIPs during crashes. A falling market makes a monthly SIP feel like throwing money into a hole, so people stop exactly when units are cheapest. This is myopic loss aversion, the version where checking a falling portfolio too often amplifies the pain, applied to the one habit, the SIP, that is designed to work best when left alone.
None of this is a reason to abandon caution, and none of it is advice about what you personally should buy. It is a description of how a well-documented bias pushes real investors, in India and the US, toward predictable mistakes.
How to reduce loss aversion
Because loss aversion is automatic, awareness alone rarely removes it. Kahneman himself said he still felt its pull and used firm rules to override it. So behavioural-finance research points less to "try harder" and more to structure. The mitigations disciplined investors describe using include:
- Automating the decision. An SIP in India or dollar-cost averaging in the US removes the moment-to-moment choice that loss aversion can hijack. Payroll and auto-debit contributions never ask you to feel the market first.
- Setting rules in advance. Deciding "rebalance once a year" or "review in April, not during a crash" means the calls get made in calm moments and executed mechanically.
- Checking less often. Frequent checking is what triggers myopic loss aversion, a term from Benartzi and Thaler's 1995 work. The maths does not change when you look at a quarterly statement and not a daily app; only the pain does.
- Writing down the thesis. A short note on why you bought something lets you judge a dip against the reason, not against the red number.
- Using lock-in instruments. Products with withdrawal friction, like PPF or EPF in India (see our guide on what PPF is), convert a moment of temptation into a structurally harder decision.
Loss aversion does not disappear. It gets routed around. For related patterns that trip up the same investors, see our explainer on the sunk cost fallacy and, on the spending side, lifestyle inflation.
Frequently asked questions
What is loss aversion in simple terms? Loss aversion is the tendency to feel the pain of losing something about twice as strongly as the pleasure of gaining the same thing. Losing ₹1,000 hurts roughly twice as much as finding ₹1,000 feels good. Daniel Kahneman and Amos Tversky formalised it in their 1979 Prospect Theory paper, and it is one of the most replicated findings in behavioural economics. It is the engine behind common money mistakes like holding losing investments too long and panic-selling when markets fall.
What is an example of loss aversion? The classic example is a coin flip. Offered a fair 50/50 bet to win ₹1,000 or lose ₹1,000, most people refuse, even though it is a fair gamble, because the possible loss feels bigger than the equal possible gain. Other everyday examples: keeping a stock that has fallen because selling would 'make the loss real', buying an extended warranty to avoid the small chance of a loss, and staying in a paid subscription because cancelling feels like losing access you already have.
What is the difference between loss aversion and risk aversion? Risk aversion is disliking uncertainty itself, so you prefer a sure outcome to a gamble with the same average value. Loss aversion is narrower: you weight losses more heavily than equal gains, measured from a reference point. A purely risk-averse person treats a possible gain and a possible loss of the same size and odds symmetrically; a loss-averse person does not, feeling the loss about twice as much. The two often appear together but they are distinct, and loss aversion can make people take on more risk (holding a losing stock) to avoid locking in a loss.
What is the loss aversion ratio, and is it 2 to 1? The commonly cited ratio is about 2 to 1, meaning a loss feels roughly twice as intense as an equal gain. The most precise figure from the research is a coefficient (lambda) of about 2.25, estimated by Tversky and Kahneman in their 1992 paper. Across studies the number ranges from about 1.8 to 2.5 depending on the stakes and context, and financial losses tend to sit at the higher end. So 'about twice as painful' is a fair summary, not a fixed universal constant.
Who discovered loss aversion? Psychologists Daniel Kahneman and Amos Tversky, in their 1979 paper 'Prospect Theory: An Analysis of Decision under Risk' in Econometrica. Kahneman received the Nobel Prize in Economic Sciences in 2002 for this body of work; Tversky had died in 1996 and Nobel prizes are not awarded posthumously, otherwise he would have shared it.
How do you reduce loss aversion when investing? Because loss aversion is an automatic emotional response, awareness alone rarely fixes it, so disciplined investors tend to rely on structure more than willpower. Common approaches described in behavioural-finance research include automating contributions (an SIP in India or dollar-cost averaging in the US), setting rebalancing rules in advance, checking the portfolio far less often (frequent checking triggers what Benartzi and Thaler called myopic loss aversion), and writing down the reason for an investment so a temporary drop is judged against the thesis and not against the red number. This is general education, not personalised advice; a licensed adviser can help with your specific situation.
In summary
Loss aversion is the tendency to feel losses about twice as intensely as equal gains, with a measured coefficient near 2.25. It is distinct from risk aversion, it traces back to Kahneman and Tversky's 1979 Prospect Theory, and it shows up in investing as the disposition effect, panic selling, and, in India especially, a strong preference for fixed deposits over equity. The bias does not respond to willpower, but it does respond to structure: automated investing, rules set in calm moments, and checking less often all shrink its grip. Knowing the 2.25 number will not stop you feeling the next loss twice as hard, but it can stop that feeling from quietly running your money.
Loss aversion is one of a dozen recurring money biases. For the full map of how they connect, and where each one costs you, see behavioral finance explained.
Sources
- Daniel Kahneman and Amos Tversky, Prospect Theory: An Analysis of Decision under Risk, Econometrica 47(2), 1979: jstor.org/stable/1914185
- Amos Tversky and Daniel Kahneman, Advances in Prospect Theory: Cumulative Representation of Uncertainty, Journal of Risk and Uncertainty 5(4), 1992 (the source of the 2.25 coefficient)
- Terrance Odean, Are Investors Reluctant to Realize Their Losses?, Journal of Finance, 1998: faculty.haas.berkeley.edu
- Shlomo Benartzi and Richard Thaler, Myopic Loss Aversion and the Equity Premium Puzzle, Quarterly Journal of Economics, 1995
- Morningstar, Mind the Gap: A Report on Investor Returns: morningstar.com
- Securities and Exchange Board of India (SEBI), investor education and household savings data: sebi.gov.in


You might also like
A sunk cost is money already spent and unrecoverable. The fallacy is continuing only because of it, how to avoid it, and why Concorde is the classic case.
12 min read

Lifestyle creep is spending that rises to match income; the latte factor is small daily spends compounding. The honest math, the critique, and ₹ and $ examples.
15 min read

An emergency fund is savings held apart from goals and investments. What counts as an emergency, and why other money decisions sit on top of it.
10 min read