FOMO in Trading & Investing: Signs and How to Avoid It

By Tapabrata Biswas · Updated July 5, 2026 · 15 min read
Researched with AI assistance, reviewed and edited by Tapabrata Biswas.
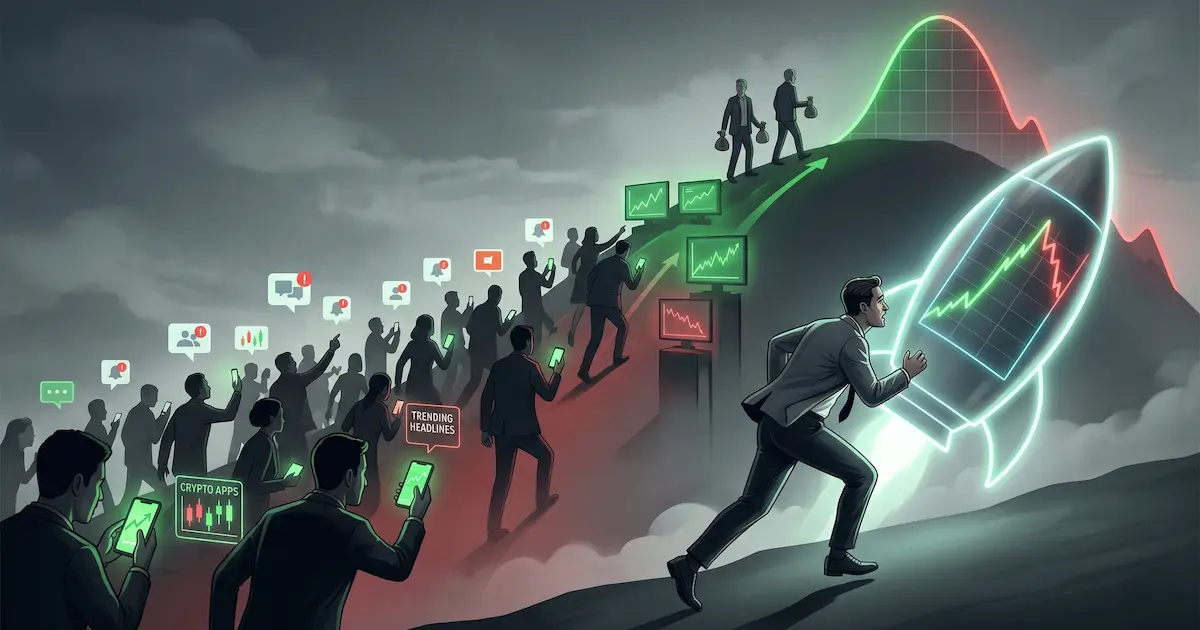
FOMO is the reason a first-time trader buys a stock the week after it has already tripled, or pours money into a coin because a Reel said it was about to "10x". The fear of missing out on gains everyone else seems to be making overrides the plan, and the buy lands near the top. It is one of the best-documented and most expensive patterns in behavioural finance.
This guide is about FOMO the behaviour, not the Fomo Corp stock ticker, the AXS FOMO ETF, or the fomo.family app, which are unrelated. It covers what FOMO means in trading and the stock market, the signs you are doing it, the market cycles it repeats through, the India F&O and crypto angles, why it usually loses money, and how people beat it with rules and not willpower.
What is FOMO in trading and investing?
FOMO in investing is the fear of missing out on a rising market that pushes people to buy an asset because others are profiting, not because it fits their own plan. FOMO stands for "fear of missing out", a term coined by Patrick McGinnis in a 2004 Harvard Business School article that later spread to markets. In trading it shows up as chasing a price that is already running, on the feeling that the move will continue and you will be left behind.
A few features define a FOMO trade:
- The trigger is external (a headline, a social post, a tip, a parabolic chart) and not your own analysis.
- The entry comes after most of the move has already happened, once the story is loud enough to reach a general audience.
- There is no written reason, target, or exit; the time horizon is a vague "until it goes up more".
- The dominant feeling is regret avoidance. The pain is not "I might lose money" but "I might miss what others are gaining".
That last point separates FOMO from a real decision. Deciding in advance to hold a small, fixed slice of a volatile asset and buying it in planned tranches is an allocation decision. Pouring a large share of your money into that asset because it just doubled is a chase. The two can look similar on the surface, but one follows a plan and the other follows the crowd. Robert Shiller, the 2013 Nobel laureate, spent two books (Irrational Exuberance and Narrative Economics) showing that bubbles are built from self-reinforcing stories that spread through social networks, where each new buyer is "validated" by the buyer before them.
Signs you are trading on FOMO
The clearest sign of a FOMO trade is buying after a sharp run-up with no written entry, exit, or risk plan. FOMO tends to announce itself through a cluster of tells, and most FOMO trades show several at once:
- You are buying mainly because the price has already gone up a lot.
- You have no written entry price, exit price, or risk limit for the trade.
- The idea came from a tip, a finfluencer Reel, or a Telegram or WhatsApp group and not your own analysis.
- The position is bigger than your usual size, because "this one is different".
- You are refreshing the price constantly after buying.
- You feel relief and not confidence once the order fills, a quiet sign you knew it was impulsive.
None of these is about the asset itself. They are about the process. A rising price is not proof of FOMO; buying it with no plan, on someone else's excitement, in an oversized position, is.
FOMO investing examples: the same cycle, again and again
A FOMO cycle is a bubble where late buyers pile into a rising asset near its top, then lose most of it when the crowd leaves. The specifics change, but the shape repeats.
- The dot-com bubble (1999 to 2000). Retail investors bought internet stocks like Pets.com and Webvan because "internet stocks always go up". The NASDAQ peaked near 5,048 in March 2000 and bottomed around 1,114 in October 2002, a 78% fall. Many 1999 buyers waited more than a decade to recover.
- Bitcoin 2017. Bitcoin ran from about $900 to nearly $20,000 in a year. Mainstream coverage exploded late in the year, retail buying surged above $15,000, and the price then fell to roughly $3,200 by December 2018, an 84% drawdown.
- The 2021 GameStop meme-stock craze. GameStop went from about $20 to $483 in three weeks on coordinated Reddit buying, with AMC close behind. Buyers near the peak saw 70% to 90% drawdowns within a year.
- Crypto pump-and-dumps and meme coins. Hype pulls buyers in near the top of a small coin, then the price collapses when the hype moves on. FOMO is the engine of the scheme.
- Hyped IPO listings, especially in India. Chasing an IPO for a listing-day pop is a recurring FOMO trigger; the pop often fades in the weeks after listing, leaving late buyers underwater.
The consistent result is that a bubble moves money from late buyers to early ones. It is not a moral story, it is arithmetic: when momentum-driven flows dominate, whoever arrives after the bulk of the move has a lower expected return than whoever arrived before.
FOMO in the Indian stock market: what the SEBI data shows
In India, the clearest price tag on FOMO is SEBI's data on futures and options traders. A SEBI study updated in September 2024 found that 93% of individual F&O traders lost money over FY22 to FY24, with aggregate losses of more than Rs 1.8 lakh crore across the three years. A later update put individual net F&O losses at about Rs 1.06 lakh crore in FY25 alone, up roughly 41% year on year, with about 91% of traders still losing and an average loss near Rs 1.1 lakh each. Retail F&O participation had grown more than 120% in three years, to close to 10 million people.
The losing profile the data describes fits FOMO exactly: young, mostly under 40, overconfident, and underprepared, drawn in by social feeds where fear of missing out replaces fundamentals. Two India-specific triggers stand out. The first is finfluencer and Telegram-driven hype; SEBI has been tightening rules on unregistered finfluencers precisely because of it. The second is IPO listing-gains FOMO, the rush to grab an allotment for a first-day pop. The lesson in the numbers is blunt: the crowd of retail derivatives traders, in aggregate, loses, even though the winners are the ones you see posting.
FOMO in crypto
FOMO in crypto is the same fear of missing out, sharpened by 24/7 markets, heavy social hype, and coins that can double or halve in a day. Bitcoin's 2017 run, from about $900 to nearly $20,000 before its 84% crash, is the reference case, and every alt-season and meme-coin cycle since has rhymed with it. Crypto FOMO is also the core lever in a pump-and-dump: coordinated hype pulls buyers in near the top, then the price collapses when the promoters and early holders sell.
Crypto FOMO travels with its own slang, and knowing it helps you spot the emotion behind the jargon:
| Term | What it means |
|---|---|
| FOMO | Fear of missing out: buying because a price is running |
| FUD | Fear, uncertainty, doubt: negative sentiment that drives selling (FOMO's mirror) |
| HODL | Hold on for dear life: staying put through volatility and not reacting |
| BTFD | Buy the dip: buying after a fall rather than chasing a rise |
| DYOR | Do your own research: the discipline that counters a FOMO impulse |
The through-line is that FOMO and FUD are the two emotional poles of a crypto market, and HODL and DYOR are the words the community uses for resisting them.
Why FOMO usually loses money
FOMO usually loses money because the crowd arrives late, near the top, where forward returns are lowest. Morningstar's research links periods of heightened FOMO to roughly 1.7 percentage points lower returns for investors than the funds they buy actually earn, because the money arrives after the run and leaves after the fall. Three mechanisms drive it.
First, valuation and mean reversion. An asset that has just posted extreme returns is usually near a peak, and forward returns from a peak are mathematically lower than from a normal starting point. FOMO buys happen exactly when attention, and price, are highest.
Second, herding amplifies volatility. When buyers are entering on emotion and not analysis, a small negative trigger can cascade into a rush for the exit, producing swings far larger than the fundamentals justify. A holder with a written thesis can sit through that; a FOMO buyer with no thesis has nothing to hold on to and sells.
Third, a holding-period mismatch. FOMO buyers expect quick gains and bail at the first drop, while the volatile assets they chase only tend to reward much longer holding periods. So they buy high, endure a drawdown past their tolerance, and sell low, locking in a loss the asset's average return would never have predicted.
How to avoid FOMO trading
People avoid FOMO trades with rules rather than willpower: a written plan, a cooling-off delay, and a clear line between an allocation decision and a chase. The tactics that show up across the research and the trading-psychology literature are consistent.
- Write the trade down first. An entry price, an exit price, and a risk limit, on paper, before the order. If a tempting idea cannot be written this way, it is usually FOMO. Any reason that leans on "but it has gone up so much" is a FOMO reason in disguise.
- Add a cooling-off delay. Put even a day or two between the impulse and the action. Most FOMO fades on its own; what still looks sensible after the delay is far more likely to be a real decision.
- Decide the mix in advance and rebalance to it. Choosing a target asset allocation ahead of time and periodically returning to it turns every new trend into a simple question: does this fit the plan, or am I being pulled to overweight it because it is hot?
- Manage the information diet. Muting the loudest hype feeds during a frenzy removes the trigger. The SEC's own investor-education note on the subject is titled, plainly, "Say 'No Go to FOMO'".
- Separate allocation from chase. A planned, sized, tranche-by-tranche position in an asset is an allocation. Piling a large share of your money in because it just ran is a chase. The first survives any price move; the second depends on the move continuing.
None of this requires resisting temptation in the moment, which is the point. FOMO is powerful precisely because it is emotional and immediate, so the defences that work are the ones set up in advance, in writing, when you are calm.
How FOMO relates to other money biases
FOMO is the individual emotion; herd mentality is the crowd mechanism that amplifies it. FOMO is the personal fear that pulls one investor into a rising crowd; herd mentality, with its safety-in-numbers instinct and information cascades, is why the crowd forms and grows in the first place. The two feed each other, which is why bubbles scale.
It also has a mirror in loss aversion. FOMO fears missing an upside and drives you to act; loss aversion fears locking in a downside and drives you to freeze or hold a loser. Opposite triggers, the same emotional override of a plan. FOMO leans on recency bias too, the habit of assuming the recent trend will continue, and it can hand you into the sunk cost fallacy later, when you refuse to sell the FOMO buy at a loss. All of these sit inside the wider set covered in our behavioural finance guide.
Frequently asked questions
What does FOMO mean in trading and the stock market? FOMO stands for fear of missing out. In trading and the stock market it means buying an asset because you see a price running and others appear to be profiting, and the fear of missing the move outweighs your usual judgement about risk. The term was coined by Patrick McGinnis in a 2004 Harvard Business School article and later spread to markets. A FOMO buy is defined by its reason (the crowd is in, so I must get in), with no plan of your own behind it.
What is the full form of FOMO? FOMO is the acronym for Fear Of Missing Out. In an investing context it describes the anxiety that makes people chase a rising stock, crypto coin, or IPO because others seem to be making money, not because the asset fits their own strategy. The opposite behaviour in markets is often called JOMO (the joy of missing out) or is expressed in the crypto term HODL, staying put through volatility and not reacting.
What are the signs you are trading on FOMO? The main signs are: buying only after a sharp run-up; having no written entry, exit, or risk plan; acting on a tip, a social-media Reel, or a Telegram or WhatsApp call rather than your own analysis; putting in a position larger than your usual size; refreshing the price constantly after buying; and feeling relief and not confidence once you are in. If your main reason for a trade is that the price has already gone up a lot, that is usually FOMO.
Is FOMO good or bad in investing? It is generally bad, because FOMO makes people buy high, near the top of a move, and then sell low when the crowd leaves. The evidence is consistent: Morningstar has linked heightened FOMO to about 1.7 percentage points lower returns, and SEBI found 93% of individual F&O traders in India lost money over FY22 to FY24. FOMO is not the same as a disciplined decision to hold a rising asset; the difference is whether you are following a plan or following the crowd.
How do you avoid or stop FOMO trading? By leaning on rules and not willpower. Write down an entry price, an exit price, and a risk limit before any trade, and skip trades that do not fit. Add a cooling-off delay (even a day or two) between the impulse and the order, because most FOMO fades. Decide your overall asset mix in advance and rebalance to it and not chasing whatever is hot. Limit exposure to hype by muting the loudest social feeds. And separate an allocation decision (a planned, sized position) from a chase decision (piling in because it just doubled).
What is FOMO in crypto? Crypto FOMO is the same fear of missing out, made sharper by 24/7 markets, heavy social-media hype, and coins that can double or halve in a day. It is the core lever in pump-and-dump schemes: hype pulls buyers in near the top, then the price collapses when the hype fades. It sits inside a slang cluster: FUD (fear, uncertainty, doubt) is the negative mirror that drives selling, HODL means holding through volatility, BTFD means buying the dip and not chasing the rise, and DYOR (do your own research) is the discipline that counters a FOMO impulse.
What is an example of FOMO in investing? The 2021 GameStop episode is the classic one: the stock ran from about $20 to $483 in three weeks on coordinated Reddit buying, and people who bought near the peak saw drawdowns of 70% to 90% within a year. Other textbook cases are the late-1990s dot-com bubble, Bitcoin's 2017 run from roughly $900 to nearly $20,000 followed by an 84% crash, and the recurring frenzy around hyped IPO listings in India. In each case, late FOMO buyers handed gains to earlier entrants.
What is the difference between FOMO and herd mentality? They are linked but distinct. FOMO is the individual emotion, the personal fear of missing a gain that makes you act. Herd mentality is the crowd mechanism, the safety-in-numbers instinct and information cascade that makes a whole group move together. FOMO is what pulls one person into the herd; herd mentality is why the herd forms and grows. Our companion guides on herd mentality and loss aversion cover the crowd mechanism and the fear-of-losses mirror in full.
In summary
FOMO in trading and investing is buying because others are profiting and missing out feels worse than losing, not because the trade fits your plan. It shows up as buying after a run-up with no written plan, usually on someone else's excitement, and it repeats through the dot-com bubble, Bitcoin 2017, the 2021 meme-stock craze, crypto pump-and-dumps, and hyped IPOs. The cost is real and measured: Morningstar's 1.7 percentage-point gap and SEBI's finding that 93% of Indian F&O traders lost money over FY22 to FY24. The defences are rules, not willpower: write the trade down first, add a cooling-off delay, decide your mix in advance, mute the hype, and keep a clear line between a planned allocation and an emotional chase.
Sources
- Securities and Exchange Board of India (SEBI), Updated study: 93% of individual F&O traders incurred losses between FY22 and FY24 (PR 37/2024, September 2024), sebi.gov.in
- Securities and Exchange Board of India (SEBI), Individual trader F&O loss data, FY25 update, sebi.gov.in
- Morningstar, FOMO Can Lead to Lower Returns, morningstar.com
- US Securities and Exchange Commission, Office of Investor Education, Say "No Go to FOMO", investor.gov
- Robert J. Shiller, Irrational Exuberance (Princeton University Press, 2000; 3rd edition 2015) and Narrative Economics (2019)
- Patrick J. McGinnis, Social Theory at HBS: McGinnis' Two FOs, The Harbus (2004), the origin of the term FOMO
- Nobel Prize in Economic Sciences 2013, Robert J. Shiller: Facts, nobelprize.org

You might also like

Herd mentality in investing is copying the crowd instead of your own analysis. How it works, the India and US bubbles, what it costs, and how to spot it.
14 min read
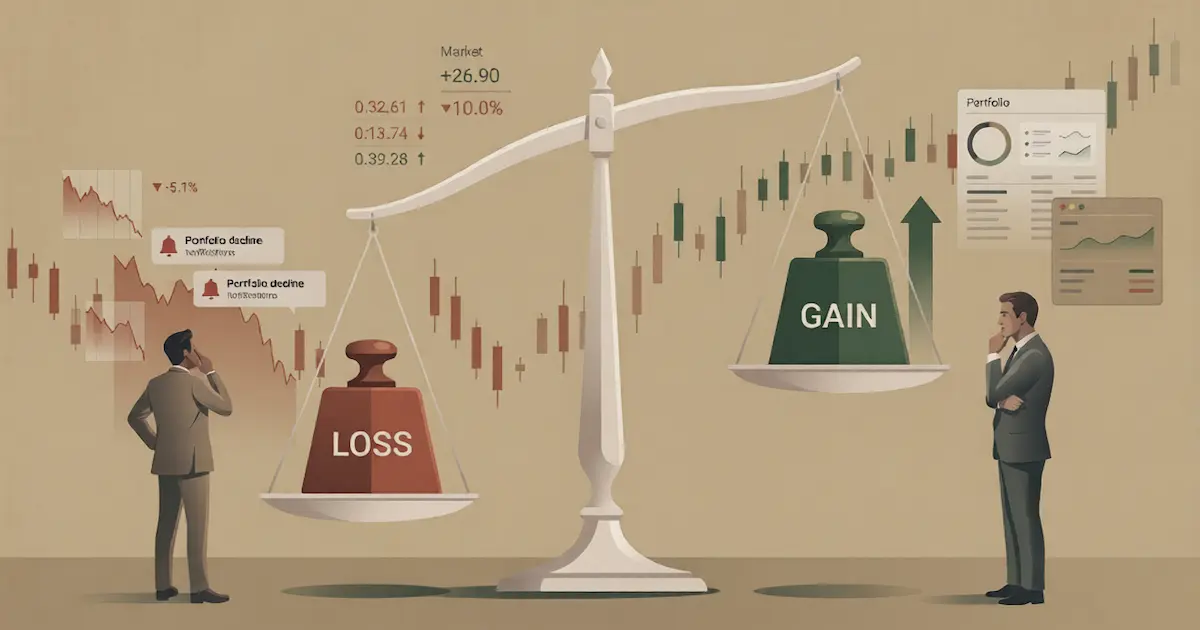
Loss aversion is feeling losses about twice as intensely as equal gains. The 2.25 ratio, examples, loss vs risk aversion, and how it quietly hurts returns.
14 min read
A sunk cost is money already spent and unrecoverable. The fallacy is continuing only because of it, how to avoid it, and why Concorde is the classic case.
12 min read