How to Track Spending: 4 Methods and a Worked Week

By Tapabrata Biswas · Updated July 16, 2026 · 14 min read
Researched with AI assistance, reviewed and edited by Tapabrata Biswas.
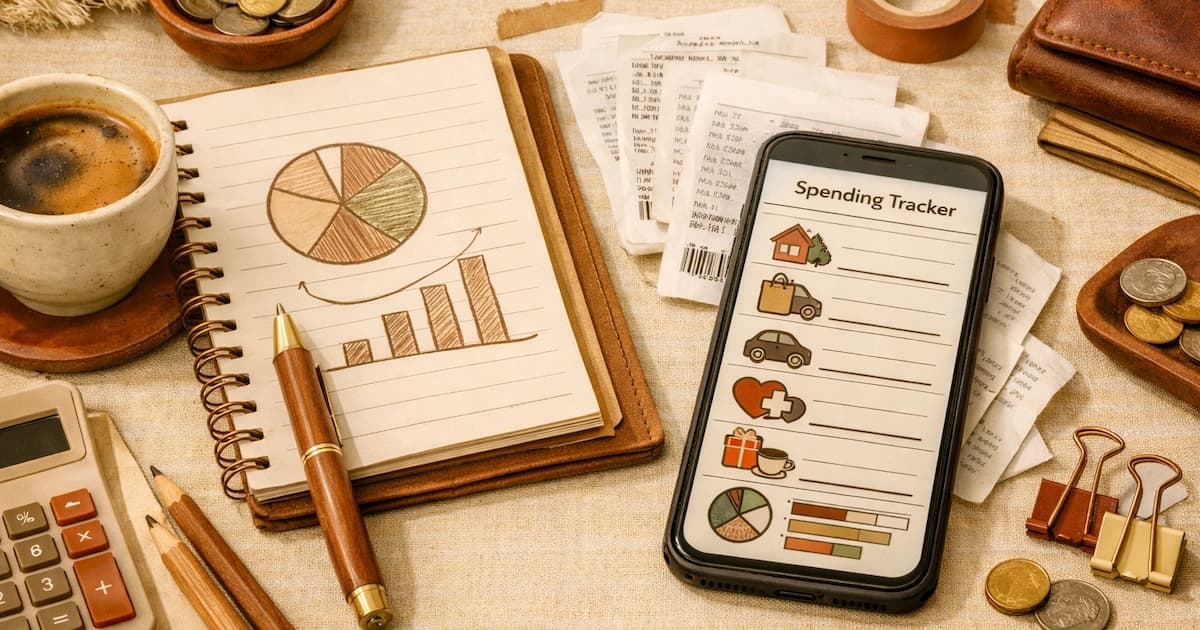
Ask someone what they spent last month and you'll usually get a number that's wrong, and wrong in a predictable direction. Eating out gets underestimated. Subscriptions get forgotten entirely. The small stuff, the ₹40 chai and the ₹180 coffee, doesn't register at all until you add it up and find it rivals the grocery bill.
The odd part is that most of that data already exists. If you're in India, UPI carried roughly 228 billion transactions worth ₹299.7 lakh crore in 2025, per NPCI figures reported by the Press Information Bureau, and your slice of it sits in your payment apps right now, timestamped and searchable. Tracking spending is mostly the work of collecting what's already recorded and naming it. This post covers what tracking actually is (and how it differs from budgeting), the four methods with an honest comparison, how the India and US mechanics genuinely differ, a full worked week you can copy, how to categorize, and how often to bother.
What is tracking spending, and how is it different from budgeting?
Tracking spending is the practice of recording what you already spent, which makes it a backward-looking measurement, while budgeting is the forward-looking plan for what you intend to spend. Tracking gives you the data. Budgeting turns the data into a plan. They're different jobs.
Most pages on this topic use the two words interchangeably, and that blur causes real damage. A budget built before you've tracked anything is a set of guesses about your own habits, which is exactly why so many first budgets fall apart in month two: the grocery number was invented, the eating-out number was optimistic, and reality arrived. Track first, then plan. The sequence isn't a preference, it's the difference between a budget built on measurements and one built on hope.
Tracking also earns its keep on its own, even if you never write a budget. The Consumer Financial Protection Bureau's research on financial well-being found that households who stay aware of their spending report higher financial well-being across income levels. Awareness is the mechanism, and tracking is how you get it. Once you can see a number, it tends to move on its own, without any rule telling it to. For the planning half of the job, see how to make a budget.
What are the ways to track spending?
Four methods cover nearly everyone: a paper notebook, a spreadsheet, an app that captures transactions automatically, and a statement audit that reconstructs spending after the fact. They trade effort against completeness in different ways.
| Method | Effort | Cost | Catches cash? | Best for |
|---|---|---|---|---|
| Notebook | High, daily | A pen | Yes, if you write it | Cash-heavy spending, people who want the friction |
| Spreadsheet | Medium, weekly | Free | Yes, if you enter it | Full control, privacy, custom categories |
| App (SMS or bank-linked) | Low, ongoing | Free to paid | No, unless added manually | Mostly digital spending, low patience for admin |
| Statement audit | One hour, monthly | Free | No | Seeing real numbers fast with zero setup |
The statement audit deserves more attention than it gets. Almost every page lists it and then never teaches it, yet it's the fastest possible start: pull the last 30 days from your bank, your cards, and your UPI apps, group every line into categories, and total them. No tool, no setup, no habit required. You get real numbers in an hour. It won't catch cash and it won't change behaviour in the moment, but as a first measurement it beats a system you'll abandon in a week.
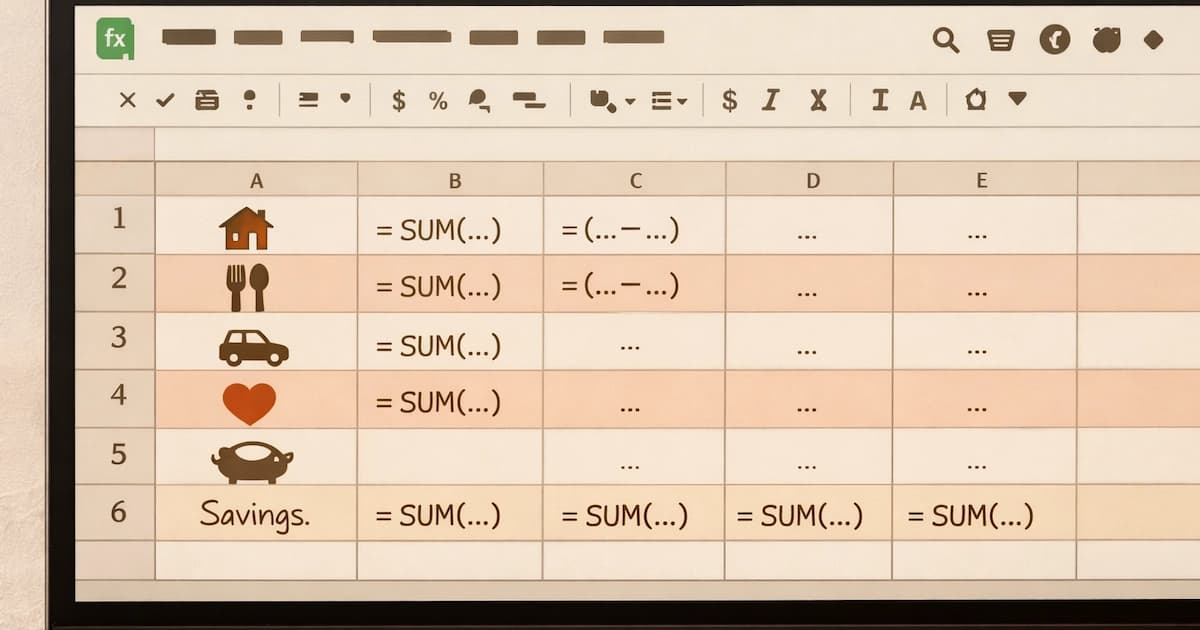
There's a genuine trade-off hiding in the effort column. Manual methods create friction, and the friction is doing work: writing "₹520, Zomato" by hand makes the spend register in a way that an app silently filing it never does. Automated methods win on completeness and lose on awareness. Which matters more depends on whether your problem is not knowing your numbers or not feeling them. For the specific apps in each market and what they cost, see our expense tracking apps guide, and for building the sheet itself, budget in Google Sheets has the columns and formulas.
How do you track spending in India?
In India, your UPI history is the most complete free spending ledger you already own, because nearly every everyday payment runs through it and each app keeps an exportable record. The mechanics here differ from the US in ways no generic guide covers.
Every major app exports. Google Pay has a Download Statement option for a chosen period. PhonePe keeps a History tab you can filter by transaction type. Paytm's Passbook exports to PDF or Excel. BHIM offers Download Statement. One caveat worth knowing before you go looking: Google Pay's in-app transaction view is built to help you verify a payment, not to summarise a month, so it offers no categorisation and points you to your bank for a full statement. The export is the useful path.
The automation model is also different. Indian expense apps like Moneyview and axio (which was Walnut before the rebrand, a detail several listicles still miss) work primarily by reading your transaction SMS, because Indian banks text you on every debit. US apps instead connect to the bank through a data link. That's why an Indian app can track a card swipe at a kirana store with no bank integration at all, and why it needs permission to read all your messages, a privacy trade-off none of the ranking pages discuss. Watch out for guides that still recommend Mint to Indian readers; Intuit shut it down in March 2024.
The consolidated answer almost nobody mentions is the Account Aggregator framework. Regulated by the RBI, an Account Aggregator lets you consent to share data across your banks, mutual funds, and insurance into a single view, with the consent revocable. Not one expense-tracking page in the field brings it up, yet it's the honest answer to "how do I see all my accounts in one place." The three-stream reality is the thing to plan around: UPI, cards, and cash all flow separately, and only the first two leave a digital trail.
What does a week of tracking actually look like?
A week of tracking is a dated list of every rupee out, tagged with a category, totalled at the end. The field talks about tracking constantly and almost never shows it, so here's a real one.
| Day | Item | Amount | Category |
|---|---|---|---|
| Mon | Groceries, UPI | ₹1,240 | Groceries |
| Mon | Chai and samosa, cash | ₹40 | Eating out |
| Tue | Auto to office, UPI | ₹90 | Transport |
| Tue | Dinner delivery | ₹520 | Eating out |
| Wed | Electricity bill, autopay | ₹1,860 | Utilities |
| Thu | Coffee, UPI | ₹180 | Eating out |
| Thu | Phone case, online | ₹399 | Shopping |
| Fri | Movie tickets | ₹700 | Entertainment |
| Sat | Vegetables, cash | ₹380 | Groceries |
| Sat | Dinner out | ₹1,450 | Eating out |
| Sun | Petrol | ₹1,500 | Transport |
| Sun | Streaming, autopay | ₹199 | Subscriptions |
Total for the week: ₹8,558. Now the totals by category, which is where the week stops being a list and starts being information:
| Category | Week total |
|---|---|
| Eating out | ₹2,190 |
| Utilities | ₹1,860 |
| Groceries | ₹1,620 |
| Transport | ₹1,590 |
| Entertainment | ₹700 |
| Shopping | ₹399 |
| Subscriptions | ₹199 |
Two things jump out, and they're the two things that jump out for almost everybody. Eating out at ₹2,190 beat groceries at ₹1,620, built almost entirely from small amounts that felt like nothing at the time. Hold that pace and it's roughly ₹1.14 lakh a year on food that isn't cooked at home. And notice which rows an app would have missed: the ₹40 chai and the ₹380 of vegetables, both cash, ₹420 that leaves no digital trace. On this week that's 5% of the total. In a cash-heavy household it can be a quarter of everything.
How do you categorize spending?
Categorising means grouping each transaction by its purpose, never by how you paid for it, so a coffee bought by UPI and a coffee bought with cash both land in eating out. Most guides say "categorise" and stop there.
Eight to twelve categories is the working range. Fewer than six and everything collapses into a blob that tells you nothing. More than twenty and every transaction becomes a small decision, which is precisely what kills the habit by week three. A practical starting set: groceries, eating out, transport, utilities, rent or EMI, subscriptions, health, shopping, entertainment, miscellaneous.
The grouping that actually earns its keep sits one level up, in three umbrellas. Fixed costs are the ones that arrive whether you act or not: rent, EMI, insurance, base utilities. Flexible costs move with your choices week to week: groceries, eating out, transport, entertainment. Non-monthly costs are the ambushes, the ones that wreck an otherwise fine month: festival spending, travel, annual renewals, car servicing, school fees. That third umbrella is the one people forget to name, and it's why a budget can look healthy for four months and then break in Diwali week. For a ready-made category layout, our monthly budget template sets out the structure.
How often should you track?
The cadence that survives contact with real life is a weekly check-in of 10 to 15 minutes on a fixed day, backed by a longer monthly review when statements land. How you spend decides which end of that range you need.
| Your pattern | Cadence that fits | What you do |
|---|---|---|
| Lots of cash, poor recall | Log at the moment or same day | Write it down before you forget |
| Mostly UPI and cards | Weekly, 10 to 15 minutes | Import, categorise, read the totals |
| Automated app, stable habits | Monthly statement review | Skim categories, catch the drift |
Weekly works for most people for a boring reason: it's close enough that you can still identify a mystery transaction from Tuesday, and rare enough that one busy week doesn't break it. A single recurring slot is easier to hold onto than a daily one. Sunday evening is the common landing spot because a lot of households already do some version of a weekly reset then.
The first month is different from every month after. Track every transaction for 30 days to get a measurement. After that, most people can drop to category-level review without losing much, because the point has shifted from measuring to maintaining.
What trips people up?
The failures are predictable, and four of them account for most abandoned tracking systems. Knowing them in advance is most of the defence.
Trying to remember instead of recording is the first, and memory is reliably wrong in one direction: it undercounts the small, frequent, discretionary stuff. The cash blind spot is the second, and it's the one automation can't solve for you, because an app that never sees your cash will hand you a clean, confident, incomplete picture. The third is concluding from a single week, when that week contained a birthday or a festival or a car repair and looked nothing like normal. The fourth is switching methods every fortnight, which guarantees you never get past the ugly first month that every method has, while the categories are still settling.
One more worth naming: too many categories on day one. Twenty-five granular lines feels rigorous for about four days. Then it feels like admin, and admin is what you quit.
What this post does not cover
This explains the practice of tracking and shows the arithmetic. It stops short of a few neighbouring jobs. Which specific app to use, in either market, and what each costs sits in our expense tracking apps guide, which is kept current on pricing. How to build the spreadsheet itself, with the columns and formulas, is in budget in Google Sheets. Turning the tracked numbers into a plan belongs to how to make a budget, and choosing between the planning systems to budgeting methods explained. Reducing what you found once you can see it is a separate exercise in how to cut expenses. None of this is advice about your money; it's a description of how the measurement works, and the numbers you turn up are yours to interpret.
Frequently asked questions
What is the easiest way to start tracking spending? The fastest start is a statement audit: pull the last 30 days from your bank account, your cards, and your UPI apps, then group every transaction into 8 to 12 broad categories and total each one. That single hour tells you what you actually spend, with no app, no spreadsheet, and no commitment to a system. In India, Google Pay, PhonePe, and Paytm each let you download a statement, so most of your spending is already recorded and waiting. It is a backward-looking measurement, so it will not catch cash, but it is the lowest-effort way to see real numbers on day one.
Is tracking spending the same as budgeting? No. Tracking spending is recording what you already spent, looking backward at what actually happened. Budgeting is planning what you will spend, looking forward. Tracking produces the data; budgeting turns that data into a plan. The order matters: a budget built before you have tracked anything is built on guesses about your own habits, which is why so many first budgets collapse in month two when the grocery or eating-out line turns out to be far off. Most pages blur the two words together, but they are separate jobs and you need both.
How do I track UPI spending in India? Every major UPI app keeps a full transaction history you can export. In Google Pay, open your transaction history and use Download Statement for a chosen period. PhonePe keeps a History tab you can filter by transaction type. Paytm shows a Passbook you can export as PDF or Excel. BHIM offers a Download Statement option. Because UPI carried roughly 228 billion transactions in 2025 per NPCI data, for most Indian households that history is already the most complete record of their spending. The catch is that it sits in separate apps, so tracking means exporting each one and merging them, and cash still has to be added by hand.
How often should I track my spending? A weekly check-in of 10 to 15 minutes, on the same day each week, plus a longer monthly review when statements arrive, is the cadence most systems settle into. Weekly is frequent enough that you can still remember an unlabelled transaction, and infrequent enough to survive a busy week. A once-a-week appointment tends to stick better than a daily two-minute habit, because one recurring slot is easier to remember than seven. If you use an app that captures transactions automatically, the weekly slot is for categorizing and reading the totals, not for data entry.
How many spending categories should I use? Between 8 and 12 categories works for most households. Fewer than 6 is too coarse to show you anything actionable, and more than 20 turns every transaction into a small decision, which is what kills the habit by week three. The useful grouping is by purpose, not by payment method, so a coffee bought by UPI and a coffee bought with cash both land in eating out. A practical starting set: groceries, eating out, transport, utilities, rent or EMI, subscriptions, health, shopping, entertainment, and miscellaneous.
How long should I track before drawing conclusions? At least 30 days, and ideally 60 to 90. One week shows you surface patterns and whatever happened to fall in that week. A month catches most recurring bills and a full pay cycle. Three months smooths out the one-offs that distort a short sample, such as a quarterly insurance premium, a festival month, a wedding, or an annual subscription renewal. Drawing conclusions from a single week is the most common early mistake, because that week is almost never a normal one.
Sources
- Press Information Bureau, UPI completes 10 years, transaction volumes and value (pib.gov.in)
- National Payments Corporation of India, UPI product statistics (npci.org.in)
- Consumer Financial Protection Bureau, Financial Well-Being in America (consumerfinance.gov)
- Consumer Financial Protection Bureau, Budgeting tools and spending tracker (consumerfinance.gov)
- Reserve Bank of India, Account Aggregator framework (NBFC-AA) (rbi.org.in)



You might also like
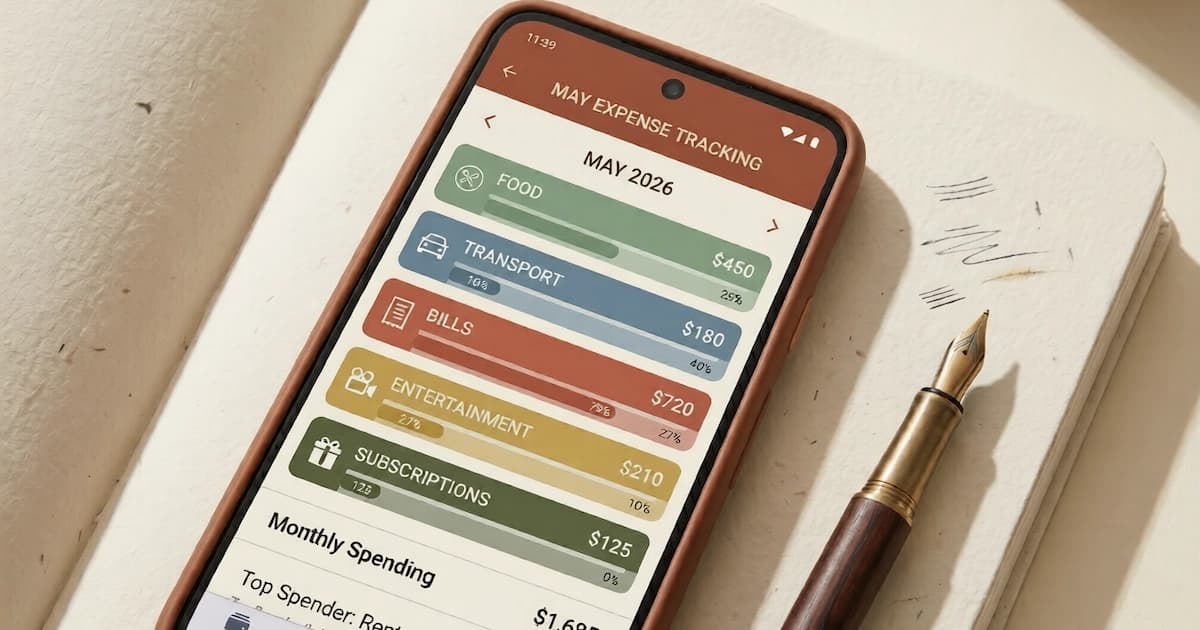
Best expense tracker apps for 2026 in the US and India, free and paid, plus how SMS-based expense tracking works and which apps still do it.
23 min read

Making a first budget step by step: the information to gather, choosing categories, picking a method, and the routine that turns setup into habit.
10 min read
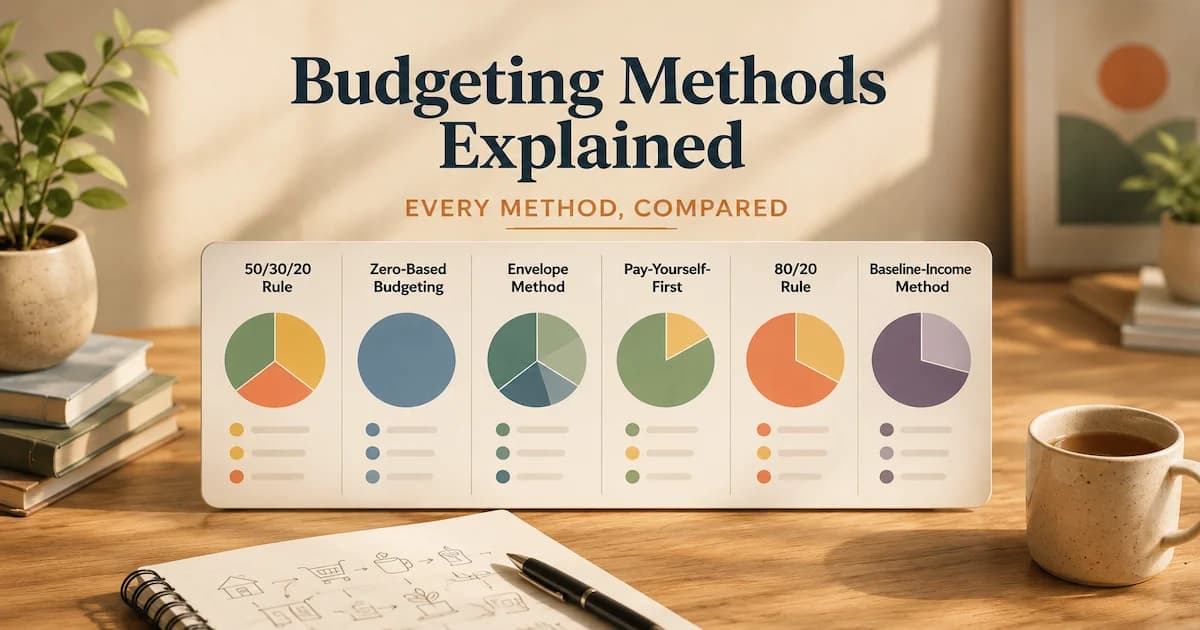
The 10 personal budgeting methods compared, from 50/30/20 and zero-based to kakeibo and cash stuffing, with ₹ and $ examples and a which-fits-you table.
17 min read