The 50/30/20 Rule: Which Net, and Where Debt Goes

By Tapabrata Biswas · Updated August 11, 2026 · 11 min read
Researched with AI assistance, reviewed and edited by Tapabrata Biswas.

Almost everyone can recite the 50/30/20 rule: half your income to needs, a third to wants, a fifth to savings. What almost no page settles are the three questions that decide whether you can actually run it. Which income figure do you split? Where does a loan payment sit? And what happens when your needs already eat 70%?
Those are the questions this page answers. For where the rule came from and how it compares with other budgeting methods, our budgeting methods guide is the hub; this one goes past the definition into the parts that trip people up in practice.
What is the 50/30/20 rule?
The 50/30/20 rule splits after-tax income into 50% for needs, 30% for wants, and 20% for savings and debt repayment. It runs on take-home pay, not gross, which every credible source agrees on.
The appeal is that it needs three numbers and no software. The problem is that all three of those numbers hide a decision the rule glosses over, and the rest of this page is about those decisions.
Which net income do you actually use?
Every page says after-tax income, and none resolves which after-tax number to use once retirement savings are already deducted. This is the first hidden decision, and it changes the answer.
If your pre-tax retirement contribution comes out before the figure you split, your single largest savings vehicle never shows up in the 20% bucket. One widely-read US explainer even defines take-home pay as what lands after "taxes, health insurance, and retirement contributions," which quietly removes the very saving the rule is trying to measure.
India makes this concrete. An EPF contribution of 12% is deducted before your in-hand salary, so a salaried person who budgets on their in-hand figure is already saving roughly 12% without seeing it. The rule never says whether that invisible 12% counts inside the 20% target or sits on top of it. Treated one way, an Indian employee saving into EPF plus a small SIP is comfortably past 20% already. Treated the other, they are told to save a fifth more on top. The honest reading is that the 20% is meant to capture all your saving, so EPF counts inside it, which means the number to split is the one before your own retirement deductions are taken out.
There is a related trap unique to India, which is starting from the wrong figure entirely. CTC is not take-home, because it bundles the employer's provident-fund share, the gratuity provision and variable pay that never reach your account. The number the rule wants is in-hand, and how CTC narrows to gross and then to in-hand is the whole subject of gross vs net income.
Where does debt repayment go?
In Warren's original rule, a minimum debt payment is a need and sits in the 50%, while any extra payment above the minimum is a form of saving and sits in the 20%. That single split resolves most of the confusion, and the ranking pages get it wrong three different ways.
Some pages put minimum payments in needs and extra in the 20%, which is correct. Others lump all debt service into the 20%, which crowds out actual saving. And several Indian pages put whole loan EMIs inside the needs bucket with no split at all, which is a plain misreading of the rule, because prepayment is not a need.
The logic is clean once you see it. The minimum keeps you current and out of default, so it protects you the way rent does, and it belongs with needs. Anything above the minimum improves your position, the way a deposit does, so it belongs with savings. If you are clearing debt aggressively, the extra you throw at a high-rate balance is the 20% bucket doing its job, which is the same money the debt avalanche directs at your most expensive loan first.
What actually counts as a need?
A cost is a need when it is contractually fixed and skipping it causes real harm, and a want when it is discretionary quality-of-life spending. That test settles more borderline cases than the static needs-versus-wants lists every page prints, because those lists disagree with each other at the edges.
Rent, utilities, groceries, insurance premiums and minimum debt payments pass the test cleanly. Dining out, streaming, upgrades and travel are wants. The interesting cases are the ones the lists fight over.
| Item | The lazy answer | The test's answer |
|---|---|---|
| A car | US pages call it a need | The commute is a need; the model and trim are a want |
| Insurance premium | Listed as a need | A protection premium is closer to the 20% than to needs |
| School fees | US templates omit it | A need in most households, absent from lists written for the US |
| A phone plan | Listed as a need | The line is a need; the flagship handset is a want |
The point is not to relabel everything, but to see that a fixed list hands you someone else's judgment. The test hands you a rule you can apply to your own spending, which is what the borderline items actually need.
What if the buckets do not fit?
The rule breaks in two ways, and its own logic points to the repair in one of them and admits defeat in the other. This is the section the ranking pages skip, and it is where most real budgets actually live.
The first break is high needs. For most metro renters the 50% target is already impossible, because rent alone can take a third of in-hand pay. Take a Mumbai renter on ₹90,000 in-hand: rent ₹35,000, groceries and utilities ₹15,000, transport ₹8,000, insurance ₹2,000 and a ₹8,000 minimum loan payment come to ₹68,000, which is 76% of income, not 50%. The rule's internal logic is to protect the savings share first and absorb the overflow from the wants bucket, so this household holds savings at a fixed slice and lets wants take the squeeze, not the reverse.
The second break is heavy debt, and here the rule has no answer. When minimum debt payments alone approach or exceed 20% of income, the entire savings-and-debt bucket is consumed by required minimums before any real saving happens. On that same ₹90,000, minimum payments of ₹20,000 are 22% of income, which fills the 20% bucket and overflows it, leaving nothing for savings while the rule still insists on 50% needs it cannot reach either. The 50/30/20 rule was built for a household with manageable debt, and it quietly stops working outside that case. The honest move is a temporary debt-first phase with a plan to return to the split once the balances come down, which the rule itself cannot describe.
Does anyone actually spend 50/30/20?
Real spending data says the 50% needs target is aspirational, not descriptive, in both countries. The rule is a goal to steer toward, and the surveys show how far most households sit from it.
In the US, the Bureau of Labor Statistics Consumer Expenditure Survey for 2024 put average household spending at about $78,535, with housing at 33.4%, transportation at 17.0%, food at 12.9% and healthcare at 7.9%. Those four alone come to roughly 71% before insurance, childcare or minimum debt enter the picture. The average household's needs are nowhere near 50%.
In India, the Ministry of Statistics Household Consumption Expenditure Survey for 2023-24 put urban food spending alone at 39.68% of consumption. The official urban rent share looks small at 6.58%, but that average is pulled down by owned and rent-free housing, so it badly understates the metro tenant whose rent is the exact line that breaks the rule. The lived experience of a Bangalore or Mumbai renter is the outlier the national average hides.
None of this makes the rule useless. A target you keep missing in the same direction still tells you something: if your needs run at 70%, the lever is housing or income, not skipping coffee. The value of 50/30/20 is as a direction, and the honest version of it says so.
What this post deliberately does not cover
This works through the parts of the 50/30/20 rule that its definition leaves unresolved. It does not tell you how to split your own income, what to cut, or which budgeting method to adopt, since those depend on numbers a general page cannot see.
Some neighbouring subjects sit elsewhere on purpose. Where the rule came from, and how it stacks up against zero-based budgeting, kakeibo and the rest, is in the budgeting methods guide. The CTC-to-in-hand question is in gross vs net income. Directing extra debt payments is in how the debt avalanche works, and sizing the savings that the 20% funds is in how much emergency fund you need.
Working out where your own spending sits against the three targets is arithmetic rather than reading, so our 50/30/20 budget calculator does that part, splitting minimum debt payments from extra repayment and adding back the EPF that never reaches your account.
Two honest limits. The spending shares here are national survey averages and your own will differ, so they show the shape of the problem more than your own number. And the 50/30/20 rule is a starting framework, not a plan for a household in financial distress, where the priorities change and a qualified counsellor is the better guide than any percentage split.
Frequently asked questions
Is the 50/30/20 rule based on gross or net income? Net, after-tax, take-home income, which every ranking page agrees on. The complication nobody resolves is which net number to use once pre-tax retirement savings are deducted. If your provident fund or 401(k) contribution is already removed before the figure you split, your largest savings vehicle never appears in the 20% bucket. In India this is sharp: EPF of 12% comes out before in-hand pay, so a salaried person budgeting on their in-hand salary is already saving about 12% invisibly, and the rule is silent on whether that counts toward the 20% or sits on top of it.
Where does debt repayment go in the 50/30/20 rule? In Elizabeth Warren's original rule, the minimum required payment on a debt is a need and goes in the 50% bucket, while any extra payment above the minimum is a form of saving and goes in the 20% bucket. Ranking pages contradict each other on this: some put all debt service in the 20%, and some Indian pages put entire loan EMIs inside needs with no split. The clean version is that the minimum keeps you current, so it is a need, and prepayment builds your position, so it belongs with savings.
What counts as a need versus a want? A useful test is whether the cost is contractually fixed and skipping it causes real harm, in which case it is a need, versus whether it is discretionary quality-of-life spending, in which case it is a want. Rent, utilities, groceries, insurance premiums and minimum debt payments pass the need test. Dining out, subscriptions and travel are wants. The hard cases are the ones static lists disagree on: a car can be a need for a commute and a want in its trim level, and a school fee is a need in most households even though US templates rarely list it. The test resolves more of these than a fixed list does.
What do you do when the 50/30/20 rule does not fit? The rule breaks in two common ways, and its own logic points to the repair. When needs run above 50%, as they do for most metro renters, the internal logic is to protect the savings share first and take the overflow from the wants bucket, leaving savings intact. When minimum debt payments alone approach or exceed 20%, the savings-and-debt bucket is fully consumed by required minimums, and the rule has no answer, because it was not designed for heavy debt loads. Both cases call for a temporary adjusted split with a plan to return to 50/30/20 as rent eases or debt clears.
Sources
-
US Bureau of Labor Statistics, Consumer Expenditure Survey, 2024 (average household spending of about $78,535, with housing at 33.4%, transportation at 17.0%, food at 12.9% and healthcare at 7.9%, together about 71%) bls.gov
-
Ministry of Statistics and Programme Implementation, Household Consumption Expenditure Survey 2023-24 (urban food at 39.68% of consumption and the urban rent share of 6.58% that understates metro tenants) mospi.gov.in
-
The Money Decoded, Gross vs Net Income (the CTC to gross to in-hand path that determines which figure the rule is calculated on) themoneydecoded.com




You might also like
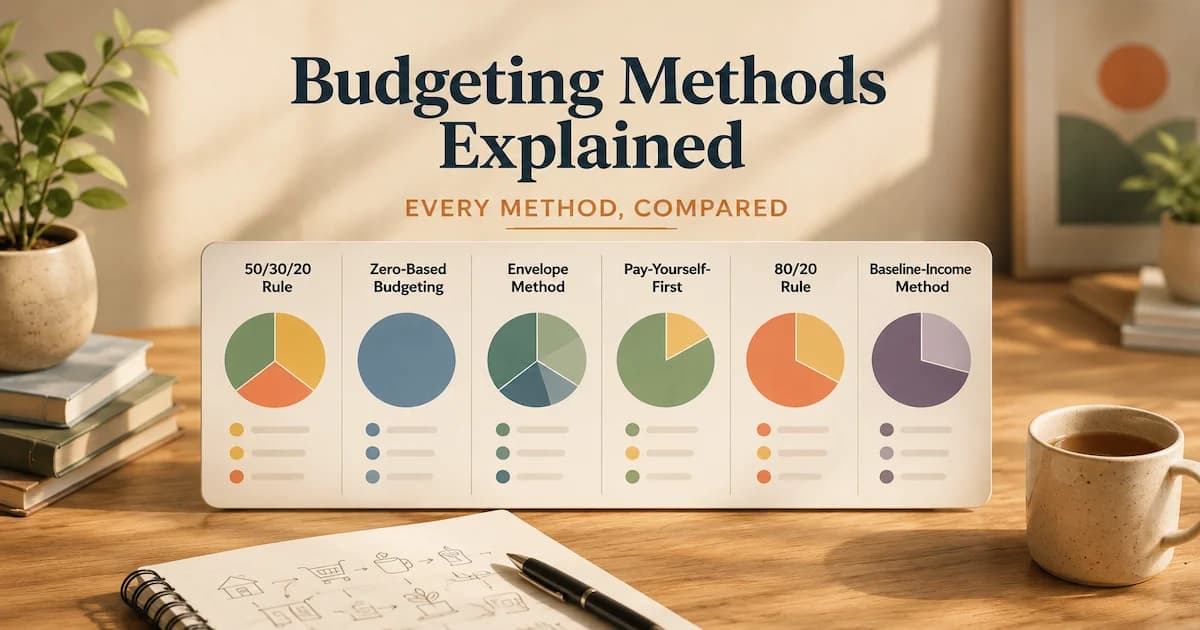
The 10 personal budgeting methods compared, from 50/30/20 and zero-based to kakeibo and cash stuffing, with ₹ and $ examples and a which-fits-you table.
17 min read

India quotes CTC. The US quotes gross. Neither is what lands in your account, and the US employer's 7.65% is the part nobody puts in the offer letter.
12 min read

The debt avalanche saves the most interest, except when it barely does. Two worked examples with real month-by-month math, for India and the US.
10 min read